Exploiting Symfony2’s Profiler
Sensio’s Symfony web framework is one of the most used PHP-based MVC web development framework that powers
a lot of well-known websites and web applications on the Internet. This framework comes with dedicated debugging tools, providing the developer with useful information about what happens when the framework renders a page. This feature is widely used on development systems but should not be available on production servers.

Introduction
Sensio’s Symfony web framework is one of the most used PHP-based MVC web development framework that powers
a lot of well-known websites and web applications on the Internet. This framework comes with dedicated debugging tools, providing the developer with useful information about what happens when the framework renders a page. This feature is widely used on development systems but should not be available on production servers. In fact, some of them are still deployed with these debugging tools enabled and that may be a source of problems as we will see later in this paper.
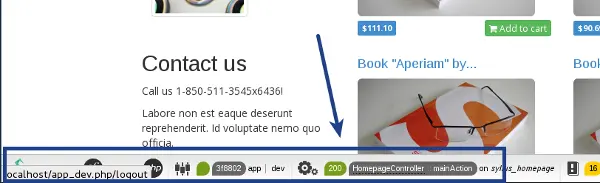
Symfony’s Profiler
One of the most useful tool provided by Symfony is its « Profiler ». This is a nifty bar located at the bottom of the page that can be used to get every type of information the developer needs: what path did the web application follow to render this page, which class and method handled the request and even every SQL requests made to produce the output !
From a penetration tester’s perspective this is usually considered as a massive leak of technical information: a phpinfo is available as well as many SQL queries and local file paths. But this is more than that, because this debugging tool also provides a feature to optimize SQL queries through an EXPLAIN statement. Basically, when you click on the ‘Explain this query’ link, the remote server executes a specific query asking the database server to tell how the query is handled internally. The results are quite limited: it gives the type of query, the number of rows manipulated, and some other interesting information. Of course, only the queries performed by the web application can be explained through this feature. Well, we thought.
Profile import/export feature
Another feature provided by this tool gives the ability to export and import profiles. A profile is the actual state in which the application is, and it may be exported in order to be imported and analyzed by
anybody, no matter what the actual state of the application is. This feature is quite interesting when
debugging tricky problems, but may also be abused.
Symfony’s Profiler allows anybody to upload a specific profile, and if it is correctly formated to use its tools to analyze it. If we are able to craft a valid profile containing one or more tampered queries, we would be able to ask the profiler to « explain » them through the database server. And maybe extract some kind of information.
A profile file is simply made of pure text corresponding to PHP serialized data. Some classes used by Symfony rely on custom serialization routines, so we had to modify an existing python-oriented unserialization library to support this specific case (phpserialize). We then were able to tamper with an existing profile and inject custom SQL queries in it. Once uploaded, the queries are made available in the « Doctrine » tab and the fun begins.
Abusing EXPLAIN queries to extract information
Requests « explained » by the database server are not executed but only evaluated. MySql returns some information about how a specific query would be processed, without ever process it (knwon as the execution plan). At first sight, it seems impossible to extract valuable information from EXPLAIN queries. Besides, if your query contains a WHERE clause, the execution plan is impacted: MySql then tries to evaluate this clause and provides a kind of warning message if this clause is always false. If this clause does not cause any problem, then this warning is not triggered. This particular behavior may be used to perform a SQL injection, even if the EXPLAIN query does not extract information from the database (makes it a kind of blind SQLi injection).
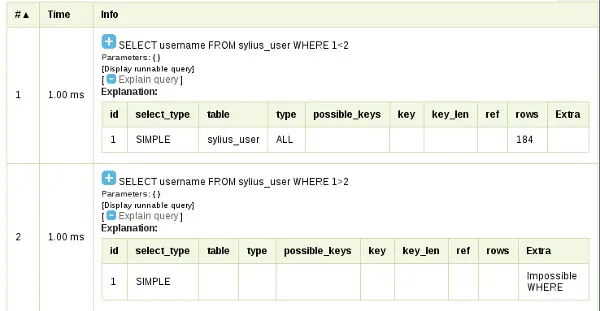
There is still a drawback using this technique, caused by the MySql’s optimizer: it is impossible to extract information from the information_schema database and therefore to extract every databases and tables structure. However, the Profiler provides the developer with complete SQL queries mentioning many table names and columns that may be used to extract valuable information.
At this point, one may easily:
- discover valuable tables and related columns,
- export a valid profile from the remote web application
We created a semi-automated exploit able to extract information from Symfony2’s profiler, given a table name and related columns. This exploit first gets a valid profile file and then tampers it to inject custom queries and explain them.
Final exploit
The following example is an extract from a vulnerable Sylius-based website deployed in a virtual machine, and especially its sylius_user table. Note that Sylius is not vulnerable, we downgraded the version of Symfony it uses to make it exploitable.
The exploit is written in Python and is available on our Github.
demo@sf2:~/$ python sf2-profiler-sqli.py --url http://localhost/ --table sylius_user --columns username,password
[i] Getting a sample profile from http://localhost/
[i] Counting records ...
[i] Table has (at least) 203 records

--[ Record 0 ] -----------------------
 username: api@example.com
 password: bxSx5f0kGuCHl09irZMvMMPB4lQWcwdmR1byNyjppaGgbqPstC5Ni2yrvUJfPrnGvwdOaZGS5x7GGBAjuMIP0Q==
---------------------------------------

--[ Record 1 ] -----------------------
 username: sylius@example.com
 password: YOOrsMmUzVZusWTJ0Yjwfs/c/Y7ECMTMHl77gi3TADbOijjTpnnPiwJnIeHwsg/orTCEVaDe6GZ4JcPrkkgBpg==
---------------------------------------

--[ Record 2 ] -----------------------
 username: sdonnelly@example.com
 password: eQyk+r/3KWO/xNY6cfYYdBOBII+d3fFBgY/jU0uTJjeVWRVYIWmfzNS+2n+KSdAYmp4ij4f5varCLQnWqW3Vdg==
---------------------------------------
Counter-measures
We found this issue some months ago, and promptly notified Sensio. They fixed it in Symfony 2.3.19, 2.4.9, and 2.5.4 (note that no fixes are provided for Symfony 2.0, 2.1, and 2.2 as they are not maintained anymore). They chose to move the profile import/export feature from the web profiler to CLI, as they explain in an official statement.
Development tools must not be deployed in production, and Symfony’s debug environment has some kind of code in order to avoid this case: it checks the originating IP address and only allows local addresses. But if a reverse-proxy is used, it may be recognized as a local user (i.e. a developer) and debug tools may be accessible from the Internet whereas it is not intended to.
As a best practice, NEVER expose a Symfony2 debug environment on the Internet.